Artificial Printing Defect Image Dataset (APDID) for image quality assessment
There is no IQA dataset specifically for printed images. So we created a dataset for printing quality assessment (PQA). This dataset contains 24 pure print images, each degraded by 55 distortions in 5 levels (, which has totally 3,720 images). Through a process known as crowdsourcing, we conducted a subjective PQA study on APDID, and then obtained (at least) 30 degradation category ratings (DCRs) per image.
Downloads
The APDID dataset contains :
- “data” folder contains 3,720 distorted images (24 original images × 31 types of distortions × 5 levels of distortions )
- “dmos.txt” file contains the differential mean opinion score (DMOS) for each distorted image. The range of DMOS is [1 5], high value of DMOS corresponds to higher visual quality of image.
- “beta.txt” file contains the indicator using the mode of the beta distribution for each distorted image. This indicator has the property of being less sensitive to outliers than DMOS.
Paper
available as soon as possible.
Author
- Ryosuke Tonegawa (r.tonegawa.589@ms.saitama-u.ac.jp)
- Yosuke sugiura(ysugiura@mail.saitama-u.ac.jp)
- Nozomiko Yasui(nyasui@mail.saitama-u.ac.jp)
- Tetsuya Shimamura(shima@mail.saitama-u.ac.jp)
Details
Category Detail
Pure print images 24 print images, which are artificially generated by transforming the color profile from RGB to CMYK (Adobe Photoshop). The original 24 images are obtained from Kodak Lossless True Color Image Suite, which are the same original images as TID-2013.
Defects 1. Bubble Marks
2. Scattered White Specks
3. Horizontal Repetitive Marks
4. Vertical Repetitive Marks
5. Coarse Pitch Black Horizontal Bands
6. Coarse Pitch Black Vertical Bands
7. Coarse Pitch White Horizontal Bands
8. Coarse Pitch White Vertical Bands
Levels 5
Scoring metric 5-point DCR (Degradation Category Rating)
Subjects 1,022 cloud workers
Number of subjects per image (at least) 30
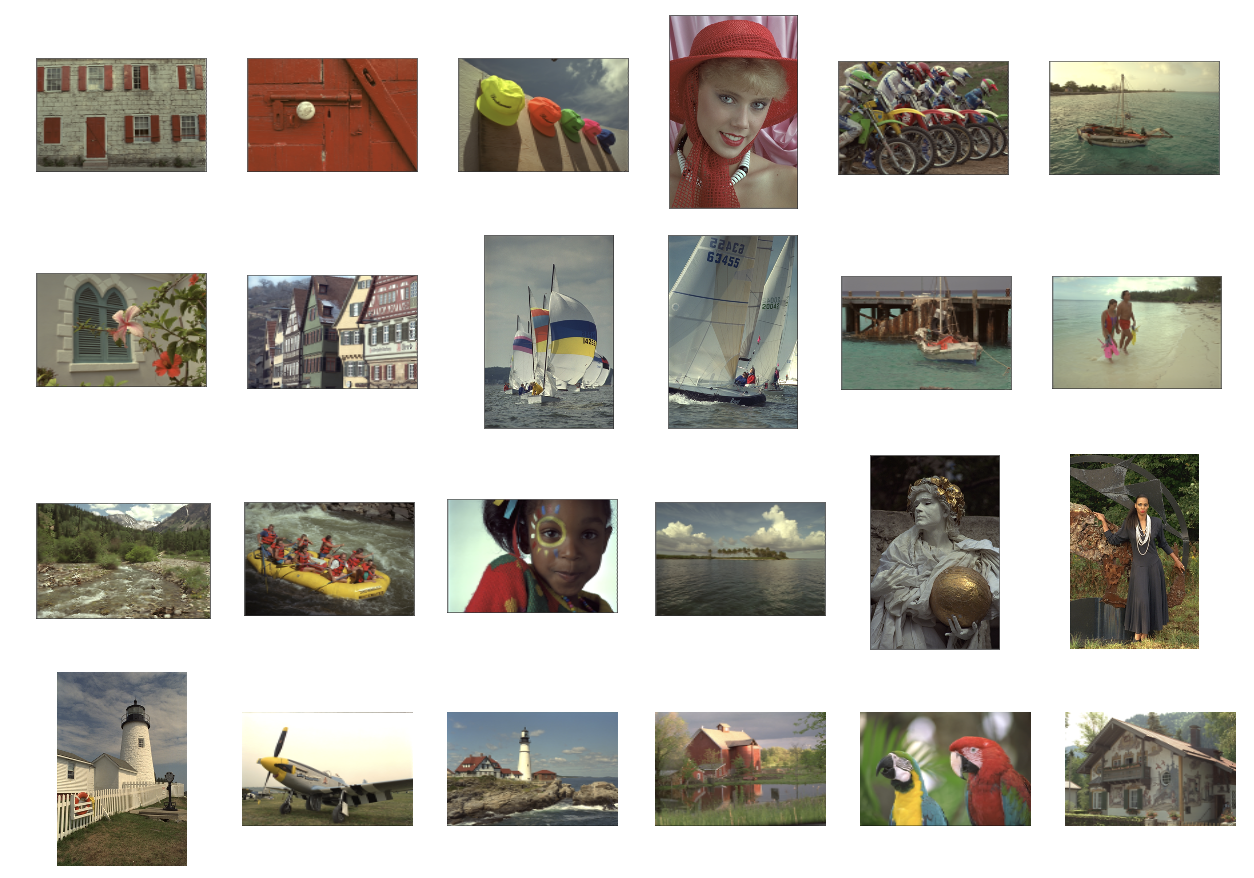
Original 24 Images in APDID
In this dataset, 24 images of “Kodak Lossless True Color Image Suite” are used as the source images for attaching defects. These images are the same as the existing IQA dataset, TID2013.
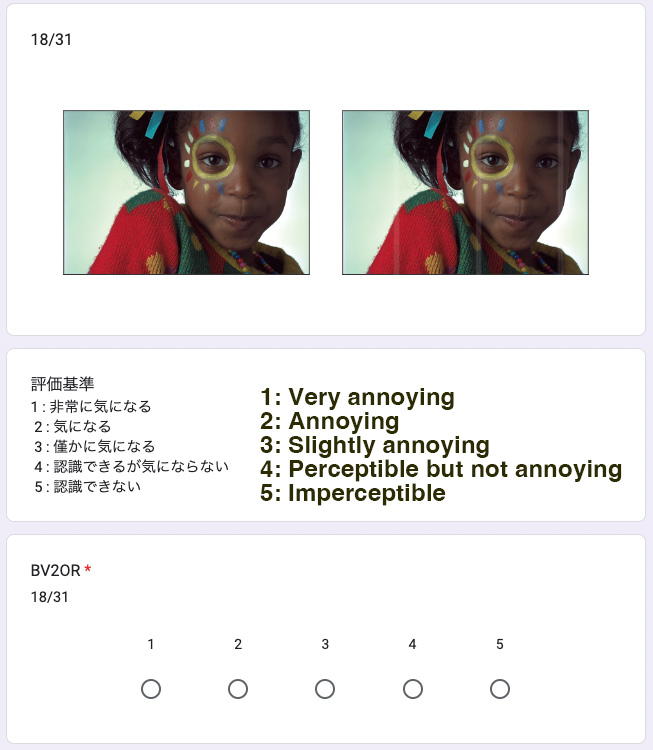
Interface for subjective IQA study
This is a subjective evaluation interface used in crowdsourcing. Relative ratings were made by placing the original image on the left and the defective image on the right (DCR). Subjects were asked, “How much do you care about the defects in the image on the right compared to the image on the left (original image)?” with 5 choices.
Details of the defects
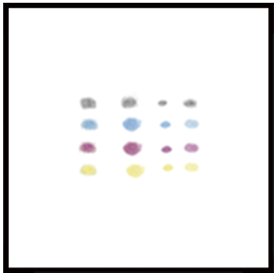
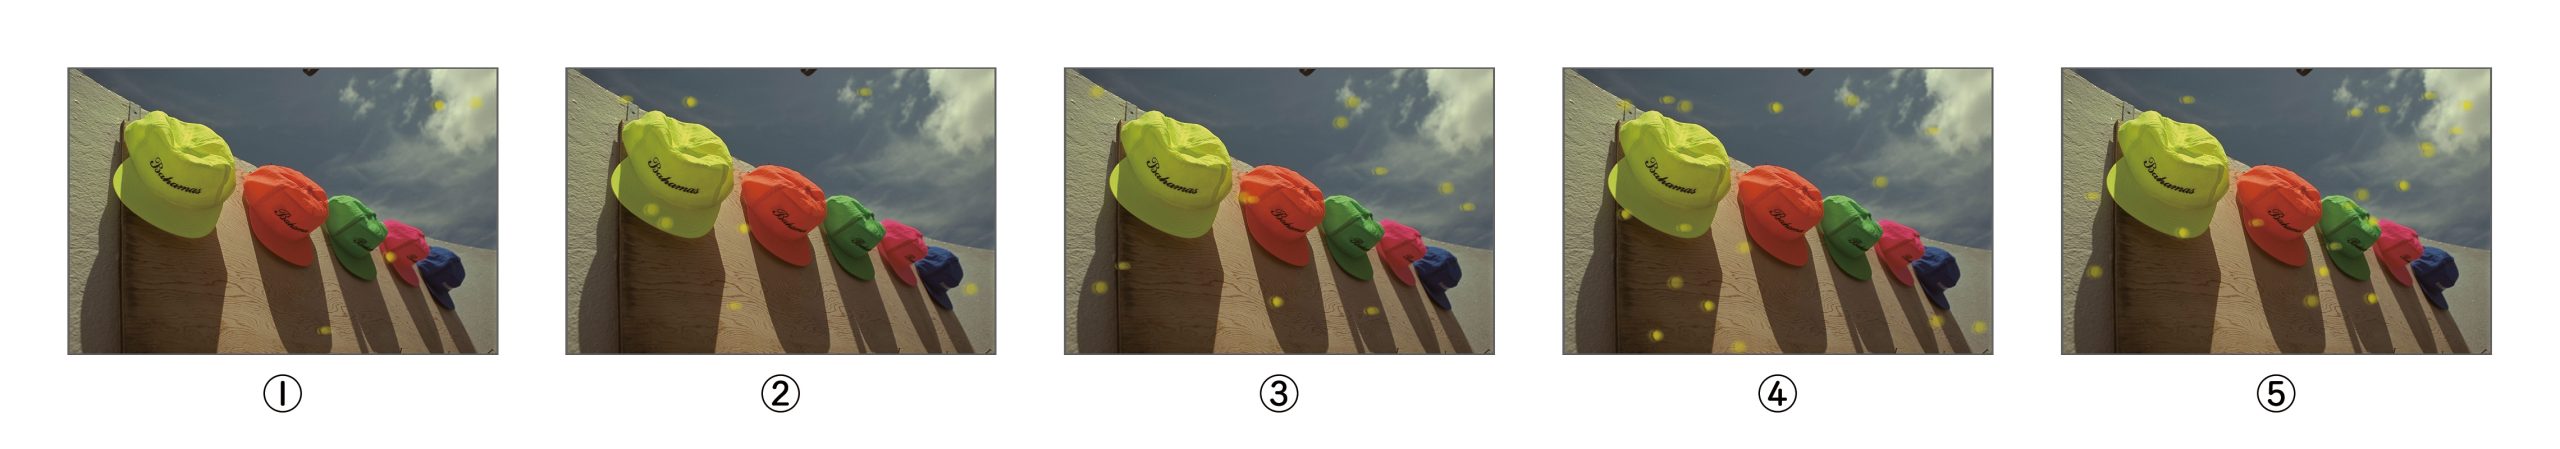
Bubble Marks
Stains due to toner leakage (4 colors)
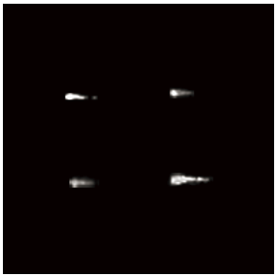
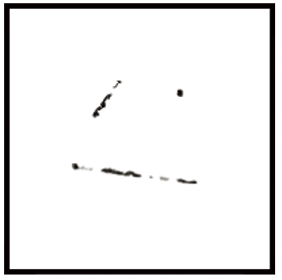
Scattered White Specks
White stains due to foreign objects in the printer
Repetitive Marks
Black dots and grazed lines due to contamination of drums and rollers
Coarse Pitch Black Horizontal Bands
Horizontal black line due to roller defect

Coarse PitchBlack Vertical Bands
Vertical black line due to roller defect
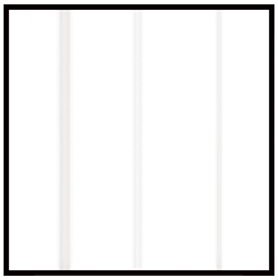
Coarse Pitch White Horizontal Bands
Horizontal white line due to roller defect

Coarse Pitch WhiteVertical Bands
Vertical white line due to roller defect

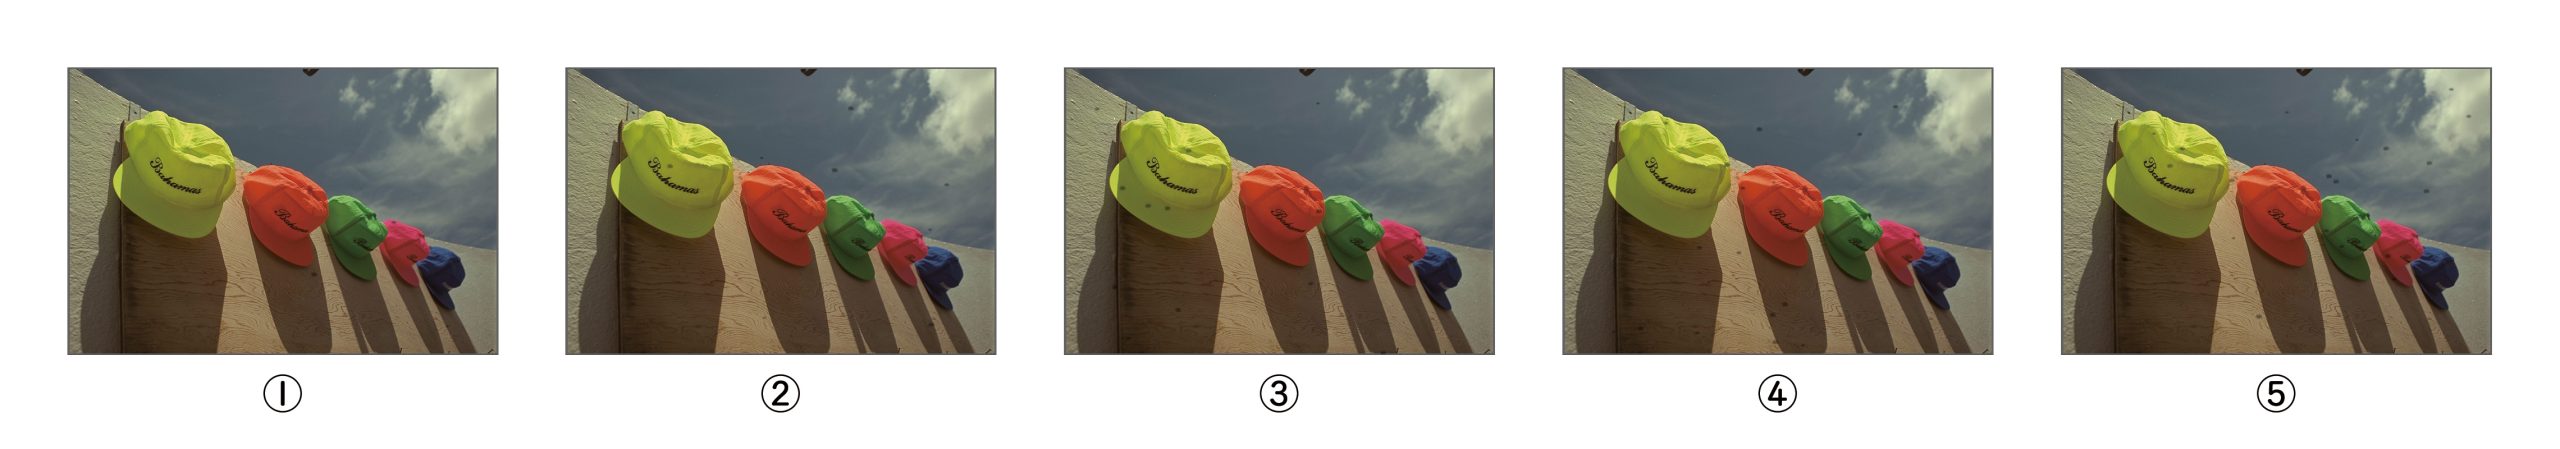
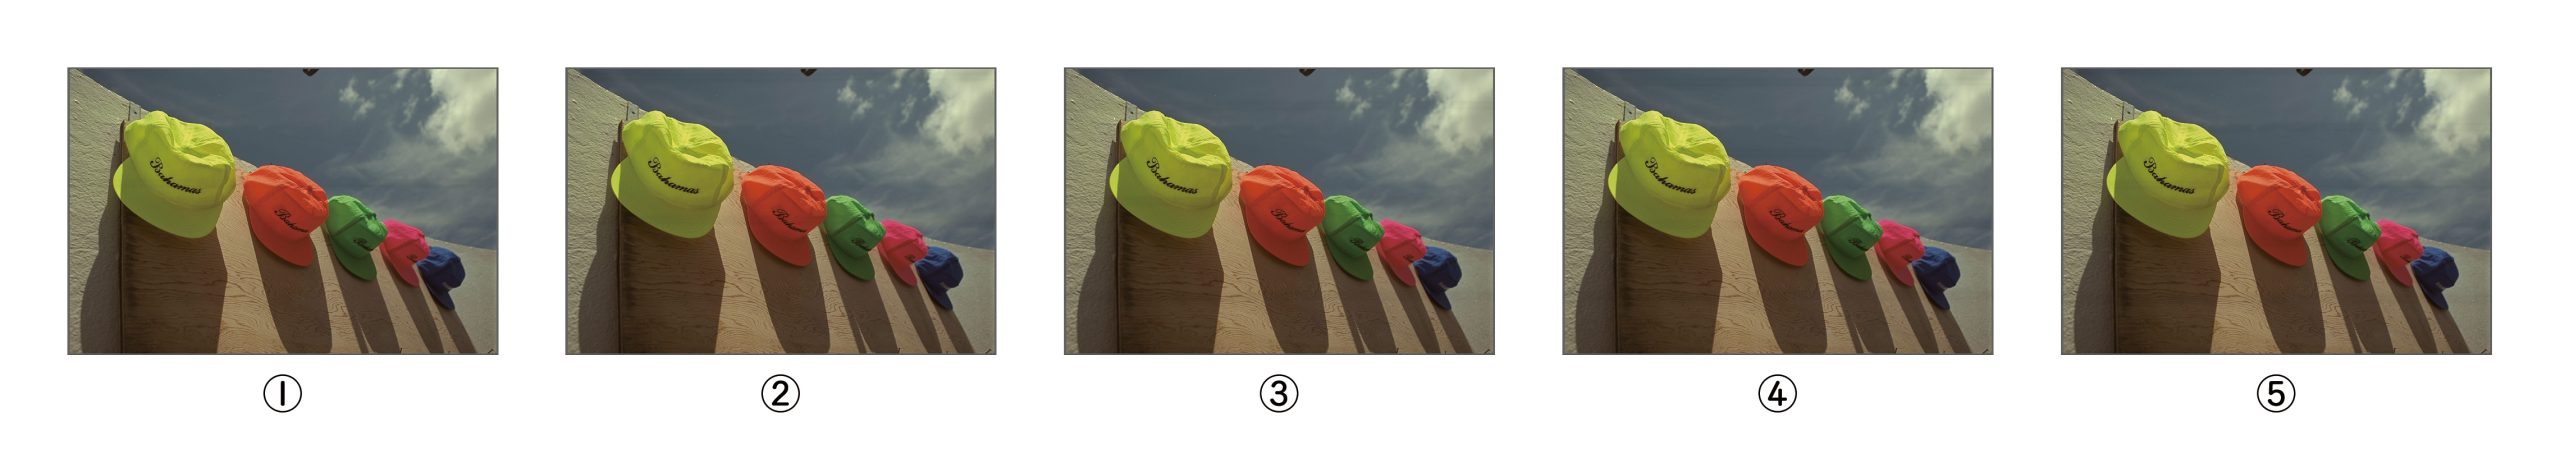
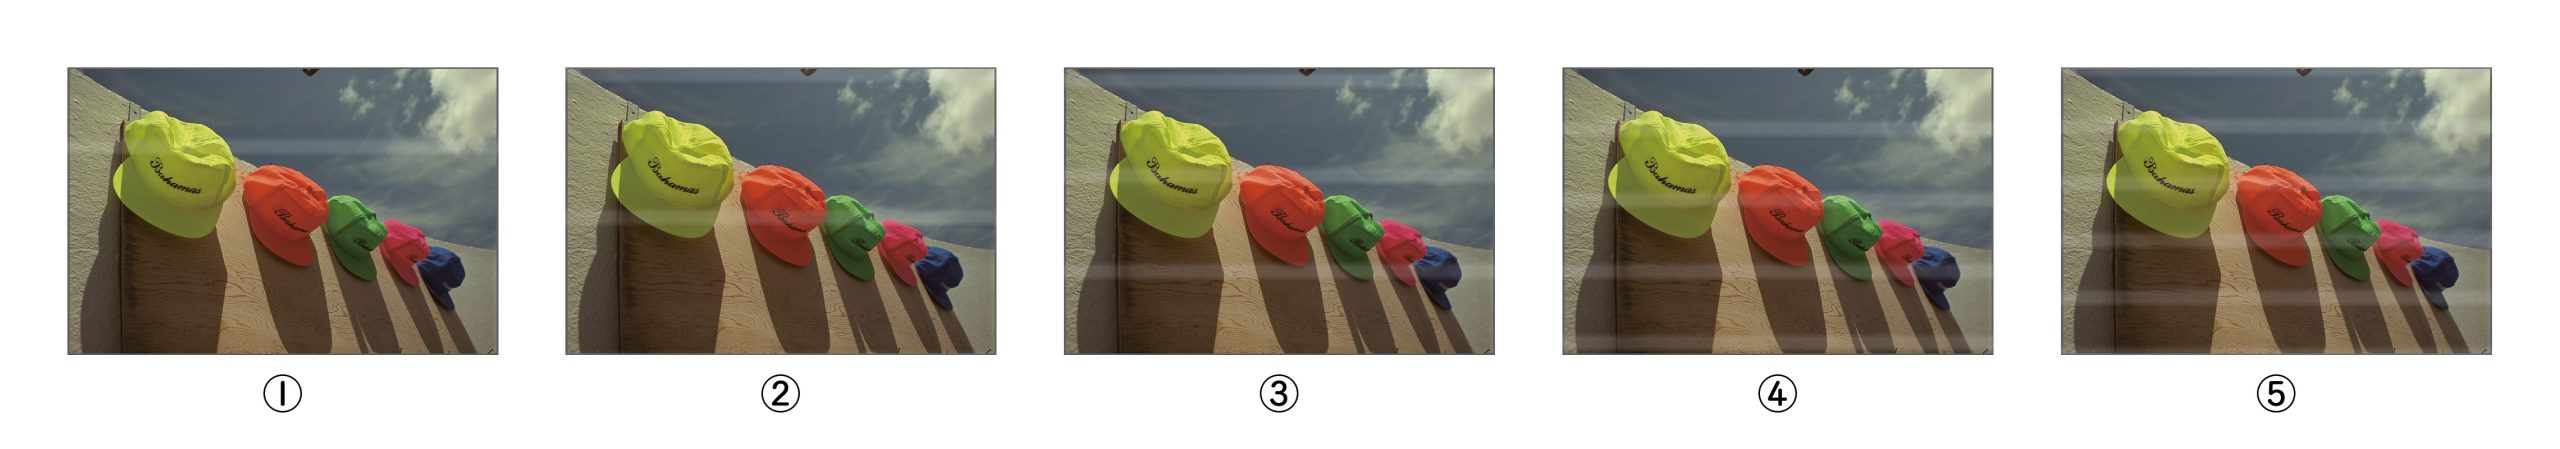
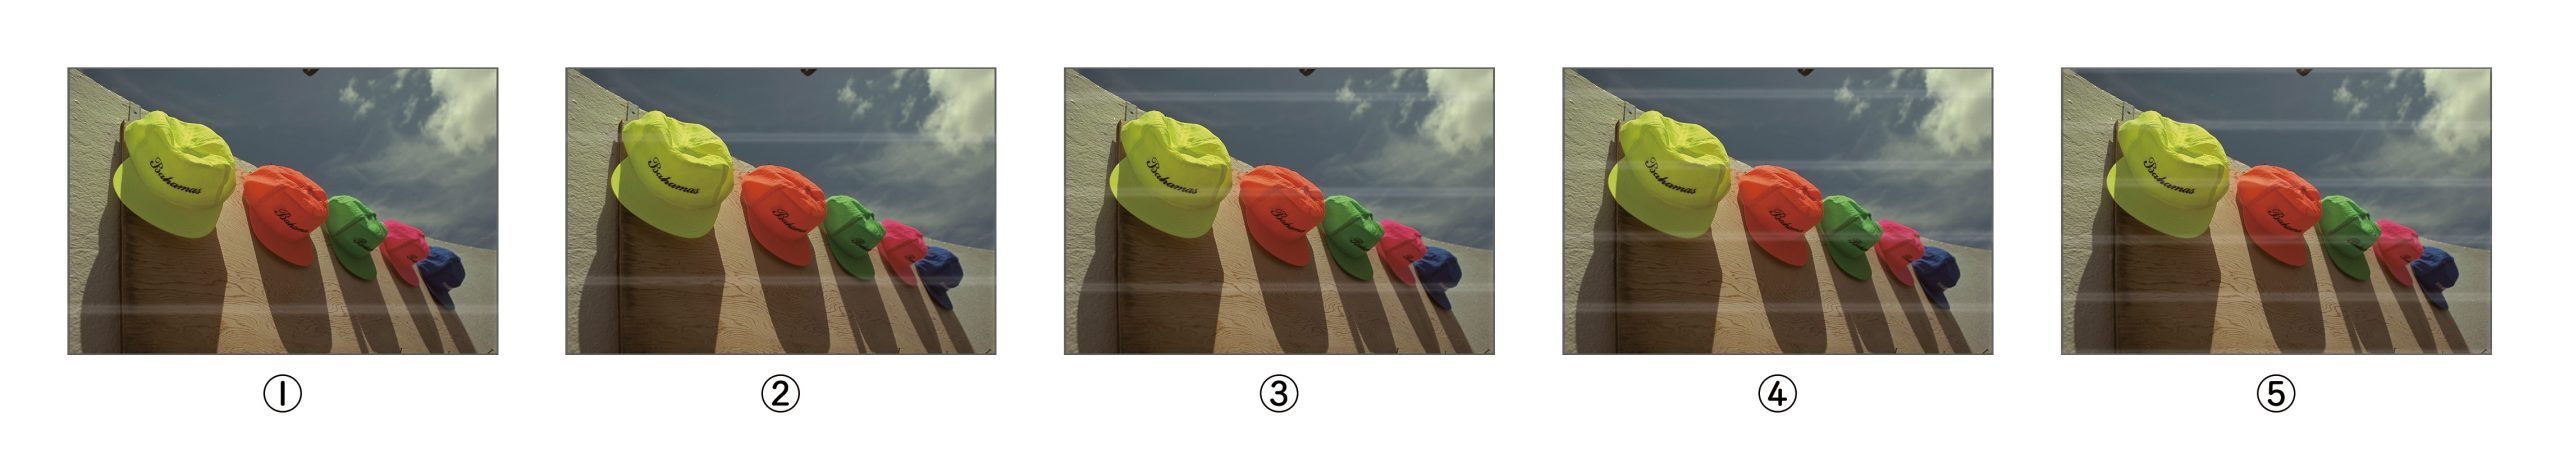
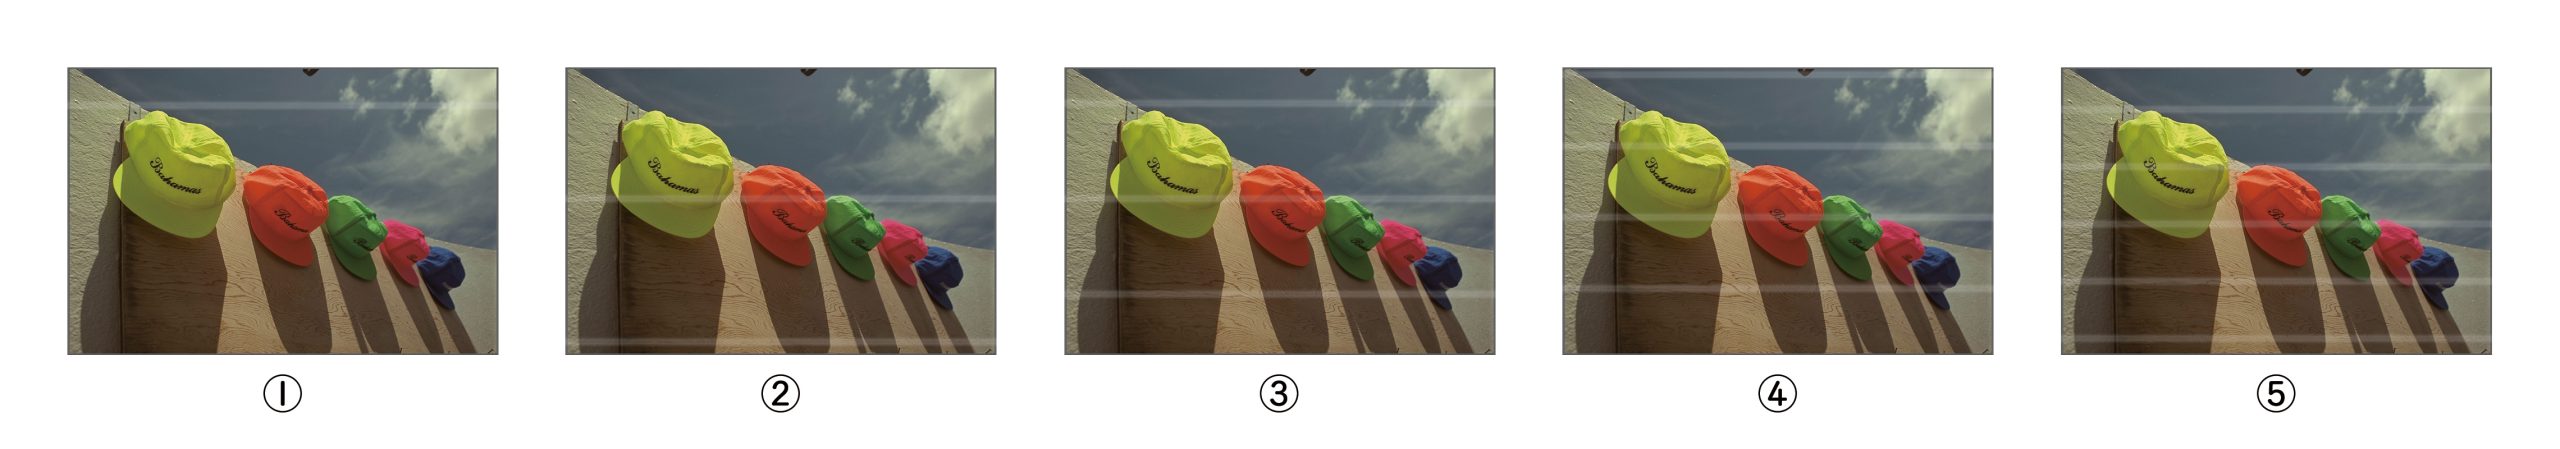
Example images with defects, 5 levels
Buble Marks Ⅰ
Buble Marks Ⅰ (Cyan )

Buble Marks Ⅰ (Magenta )

Buble Marks Ⅰ (Yellow)

Buble Marks Ⅱ

Buble Marks Ⅱ (Cyan )

Buble Marks Ⅱ (Magenta )

Buble Marks Ⅱ (Yellow)

Buble Marks Ⅲ

Buble Marks Ⅲ (Cyan )

Buble Marks Ⅲ (Magenta )

Buble Marks Ⅲ (Yellow)
Scattered White Specks

Horizontal Repetitive Marks Ⅰ

Horizontal Repetitive Marks Ⅱ

Horizontal Repetitive Marks Ⅲ

Vertical Repetitive Marks Ⅰ

Vertical Repetitive Marks Ⅱ

Vertical Repetitive Marks Ⅲ

Coarse Pitch Black Horizontal Bands Ⅰ

Coarse Pitch Black Horizontal Bands Ⅱ
Coarse Pitch Black Horizontal Bands Ⅲ

Coarse Pitch Black Vertical Bands Ⅰ

Coarse Pitch Black Vertical Bands Ⅱ

Coarse Pitch Black Vertical Bands Ⅲ
Coarse Pitch White Horizontal Bands Ⅰ
Coarse Pitch White Horizontal Bands Ⅱ
Coarse Pitch White Horizontal Bands Ⅲ
Coarse Pitch White Vertical Bands Ⅰ

Coarse Pitch White Vertical Bands Ⅱ
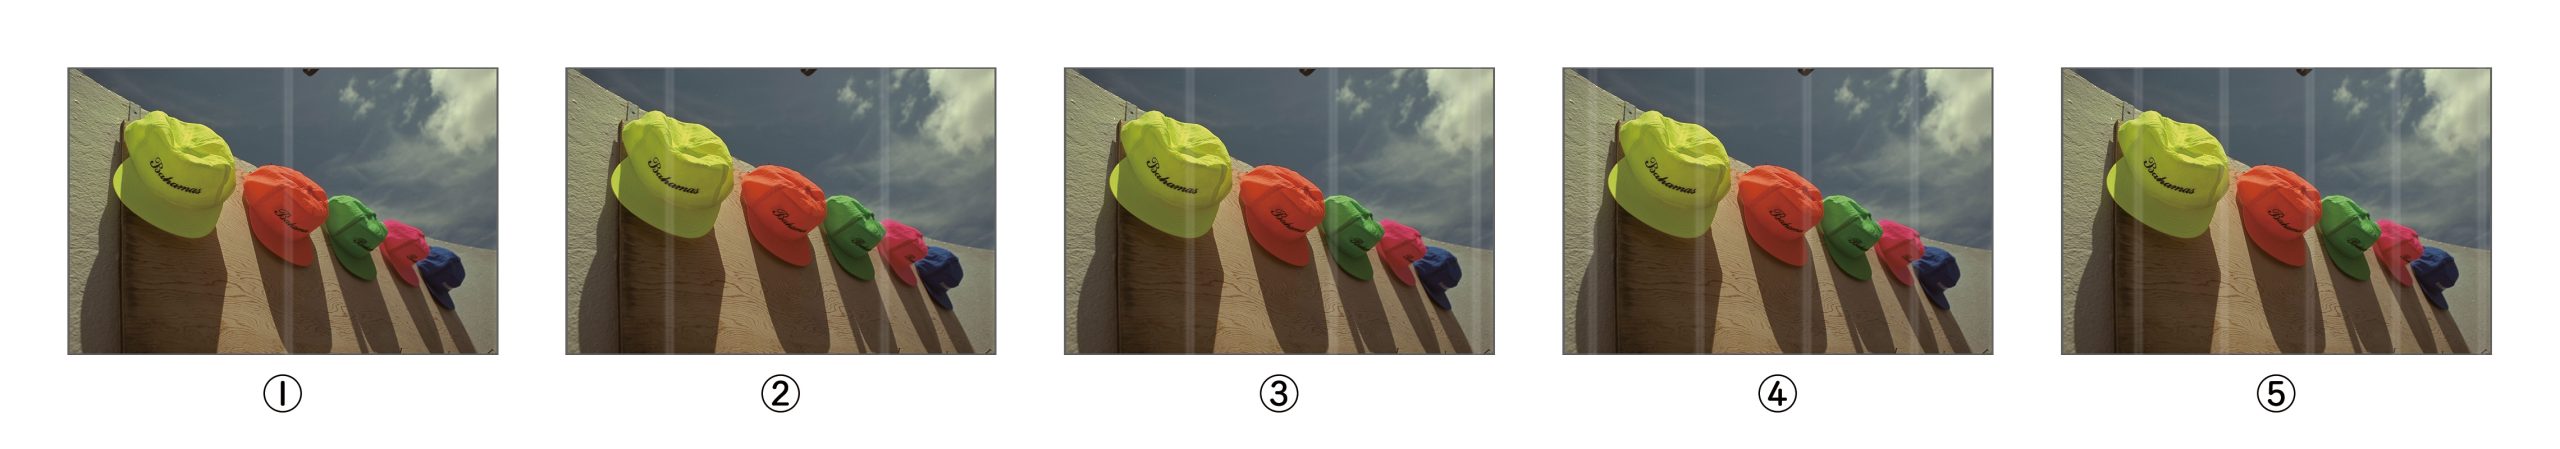
Coarse Pitch White Vertical Bands Ⅲ
